
Feature · Trends
See what changed
Upload reports from any lab, any year. We line them up: improved, worsened, stable.
Free, no sign-upAny lab, any countryYour file stays in your browserEU · GDPR

Any lab
Different labs, different PDFs — one timeline.
Health index over time
One number for the whole picture, and every marker underneath.
By system
Metabolism, inflammation, blood count, kidneys — what moved where.
Rhythm
A re-test every ~90 days shows whether the plan works.
In the app
Real screen, sample data. Free gives you the overview; Premium (€19.99 once) unlocks this feature for life.
Compare Free and Premium →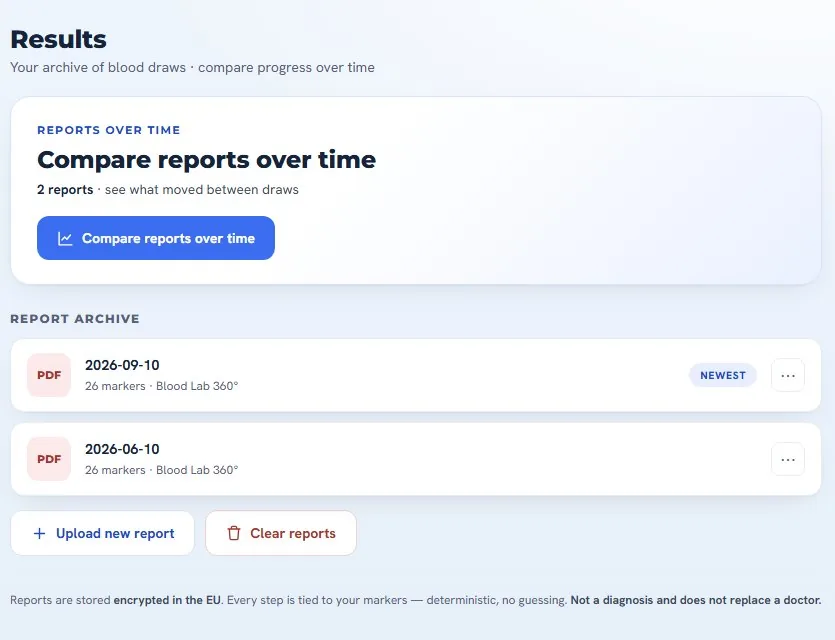
More features
Everything works together
Explained valuesGreen, yellow or red for each marker.90-day planA day-by-day plan for the values that need work.Risk areasYour markers are combined into recognised risk scores: heart, insulin resistance, fatty liver, iron stores.AI chatThe chat answers only from your measured values and our sourced knowledge base.Follow-up testsEvery value that needs work gets a re-test date and a reason.Biological ageBiological age from 9 blood markers — how your body works compared with your calendar age.